Thermal Drone Surveys for Irrigation Leak Detection
Thermal imaging reveals underground leaks before they cause visible crop damage.
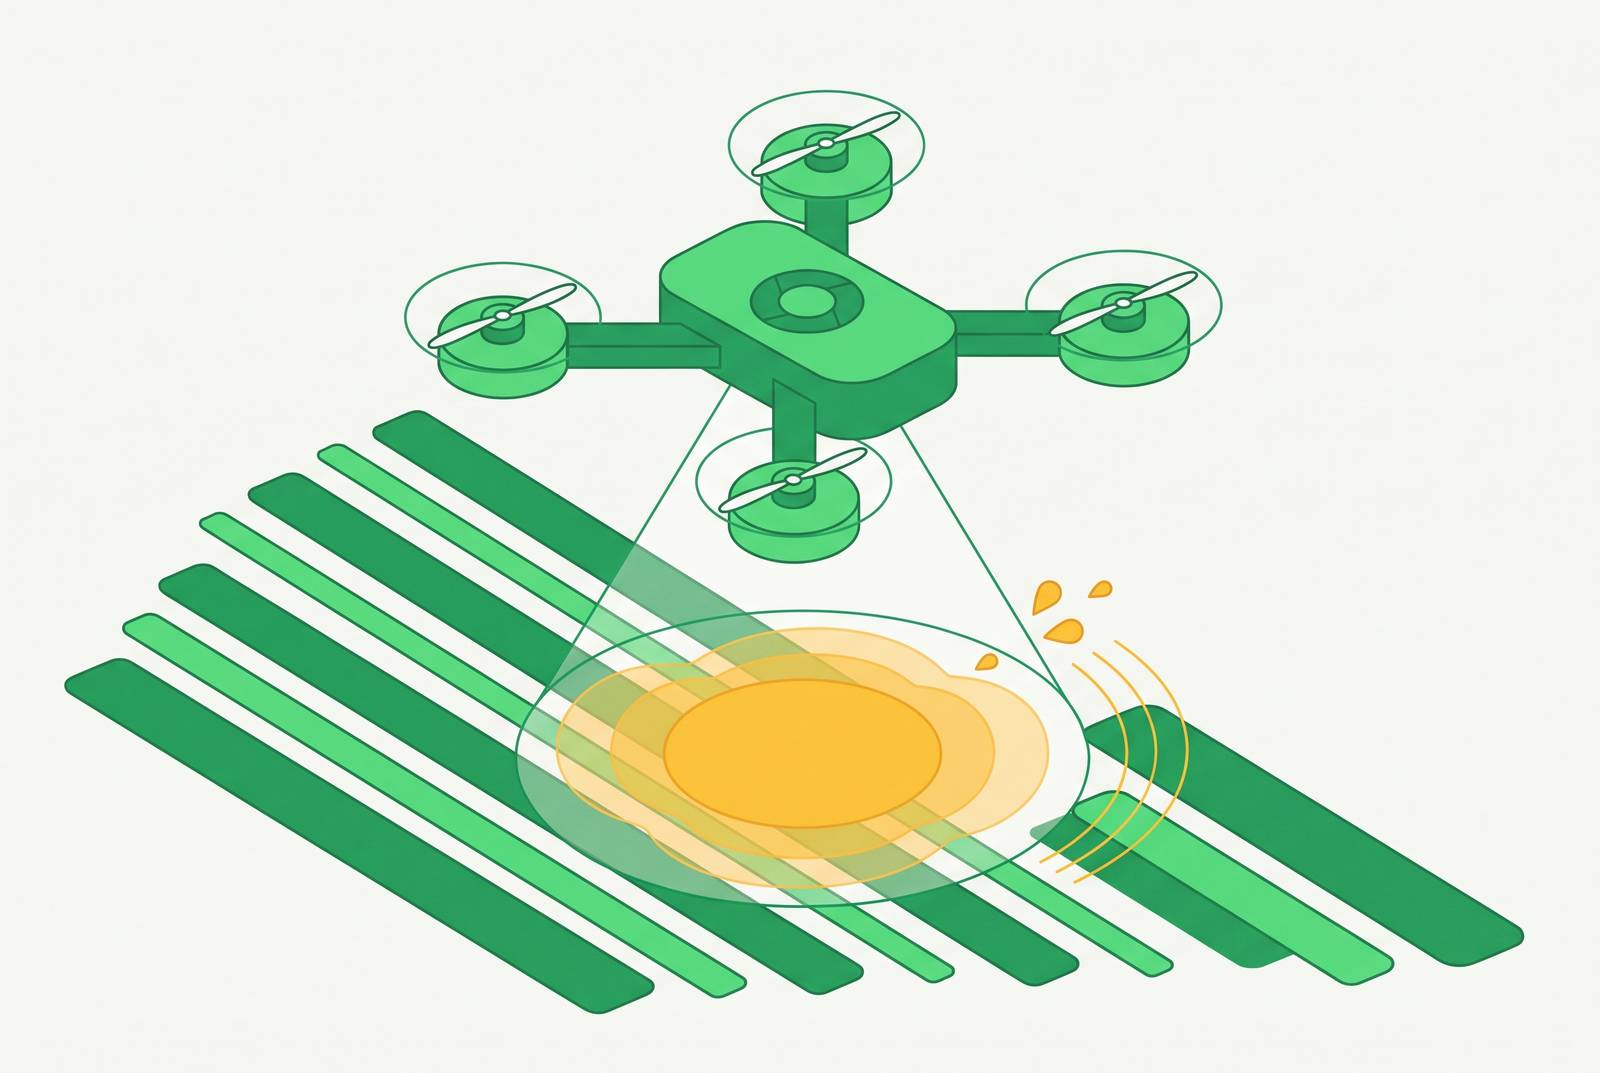
Thermal drone surveys find irrigation leaks by reading the infrared signature that wet soil and stressed plants give off, long before a puddle or a dead patch ever shows up on the ground. That signature reads out in degrees, not guesswork, and it turns a walk-the-rows inspection into a data set covering a whole field in one flight.
Why irrigation water losses demand a better detection method
Agriculture draws more freshwater than any other human activity, and the number usually attached to that fact is 70%. A 2025 citation-network study published via Oxford/PNAS complicates that tidy figure: tracing the claim back through the literature, the study found the real range is somewhere between 45% and 90%, which is another way of saying nobody has pinned it down precisely. Both numbers matter here. The 70% figure is the one policymakers keep citing, while the 45-90% range is the one the data actually backs up.
What isn't in dispute is how much of that water never reaches a crop root. The FAO puts losses in many traditional irrigation systems above 50%, lost to evaporation, leaky infrastructure, and distribution systems that were never built for precision in the first place. The scale of the problem is tracked at the global level through databases such as FAO's AQUASTAT. The exposure keeps growing, too: 23% of the world's cultivated land was under irrigation in 2022, up from 21.5% in 2015. More irrigated acreage means more buried pipe, more drip line, more pumps, and more spots where water disappears before anyone notices.
Manual leak detection cannot keep up with that math, and it never really could. Walking a field or checking drip emitters by hand only catches what shows on the surface, but a below-ground leak can run for weeks before it turns into a wilted patch or a soggy row. By then the water's gone and the yield damage is usually already locked in. Anyone still relying on visual inspection alone is finding leaks weeks after they started, not the day they started, and that gap is the entire cost of the method.
How thermal cameras see what the human eye cannot
A thermal camera doesn't record light. It records infrared radiation, which every object above absolute zero gives off, and builds its image out of temperature differences across a surface rather than color or brightness. That distinction matters in a field, because two thermal events happen out there that a normal camera will never pick up.
The first is a soil signature. Active moisture, whether from a working leak or ordinary saturation, cools the ground through evaporation, so wet soil reads cooler than the dry soil sitting next to it. A subsurface leak can change the thermal profile of the ground directly above it, often before the problem is visible at the surface. The second is a plant signature, and it runs the opposite direction. A water-stressed plant closes its stomata to cut down on transpiration, so canopy temperature climbs; an over-irrigated or leaking zone does the reverse, staying cooler than the canopy around it. Together, those two signatures let a single flight tell a dry patch losing water underground apart from a patch that's simply thirsty⟧c7⟧.
Soil type decides how cleanly that signal comes through, and this is where a lot of survey planning falls apart before the drone ever leaves the ground. Clay-rich soil holds moisture in place, so a leak's thermal anomaly stays tight and localized, easy enough to circle on a map. Sandy soil lets water disperse fast, smearing the anomaly out until it's hard to isolate from background noise. The same leak looks like two different problems depending on what it's leaking into, and any survey plan that skips soil texture going in will misjudge severity on at least one of those two soil types.
The Crop Water Stress Index, turning temperature readings into irrigation decisions
Raw thermal imagery is just a stack of temperature values on its own, nothing more. The Crop Water Stress Index is what turns that stack into something an irrigation manager can actually act on, and it's the standard output of thermal UAV surveys built for this purpose. Idso and colleagues proposed the index originally, building it around canopy temperature as the core variable.
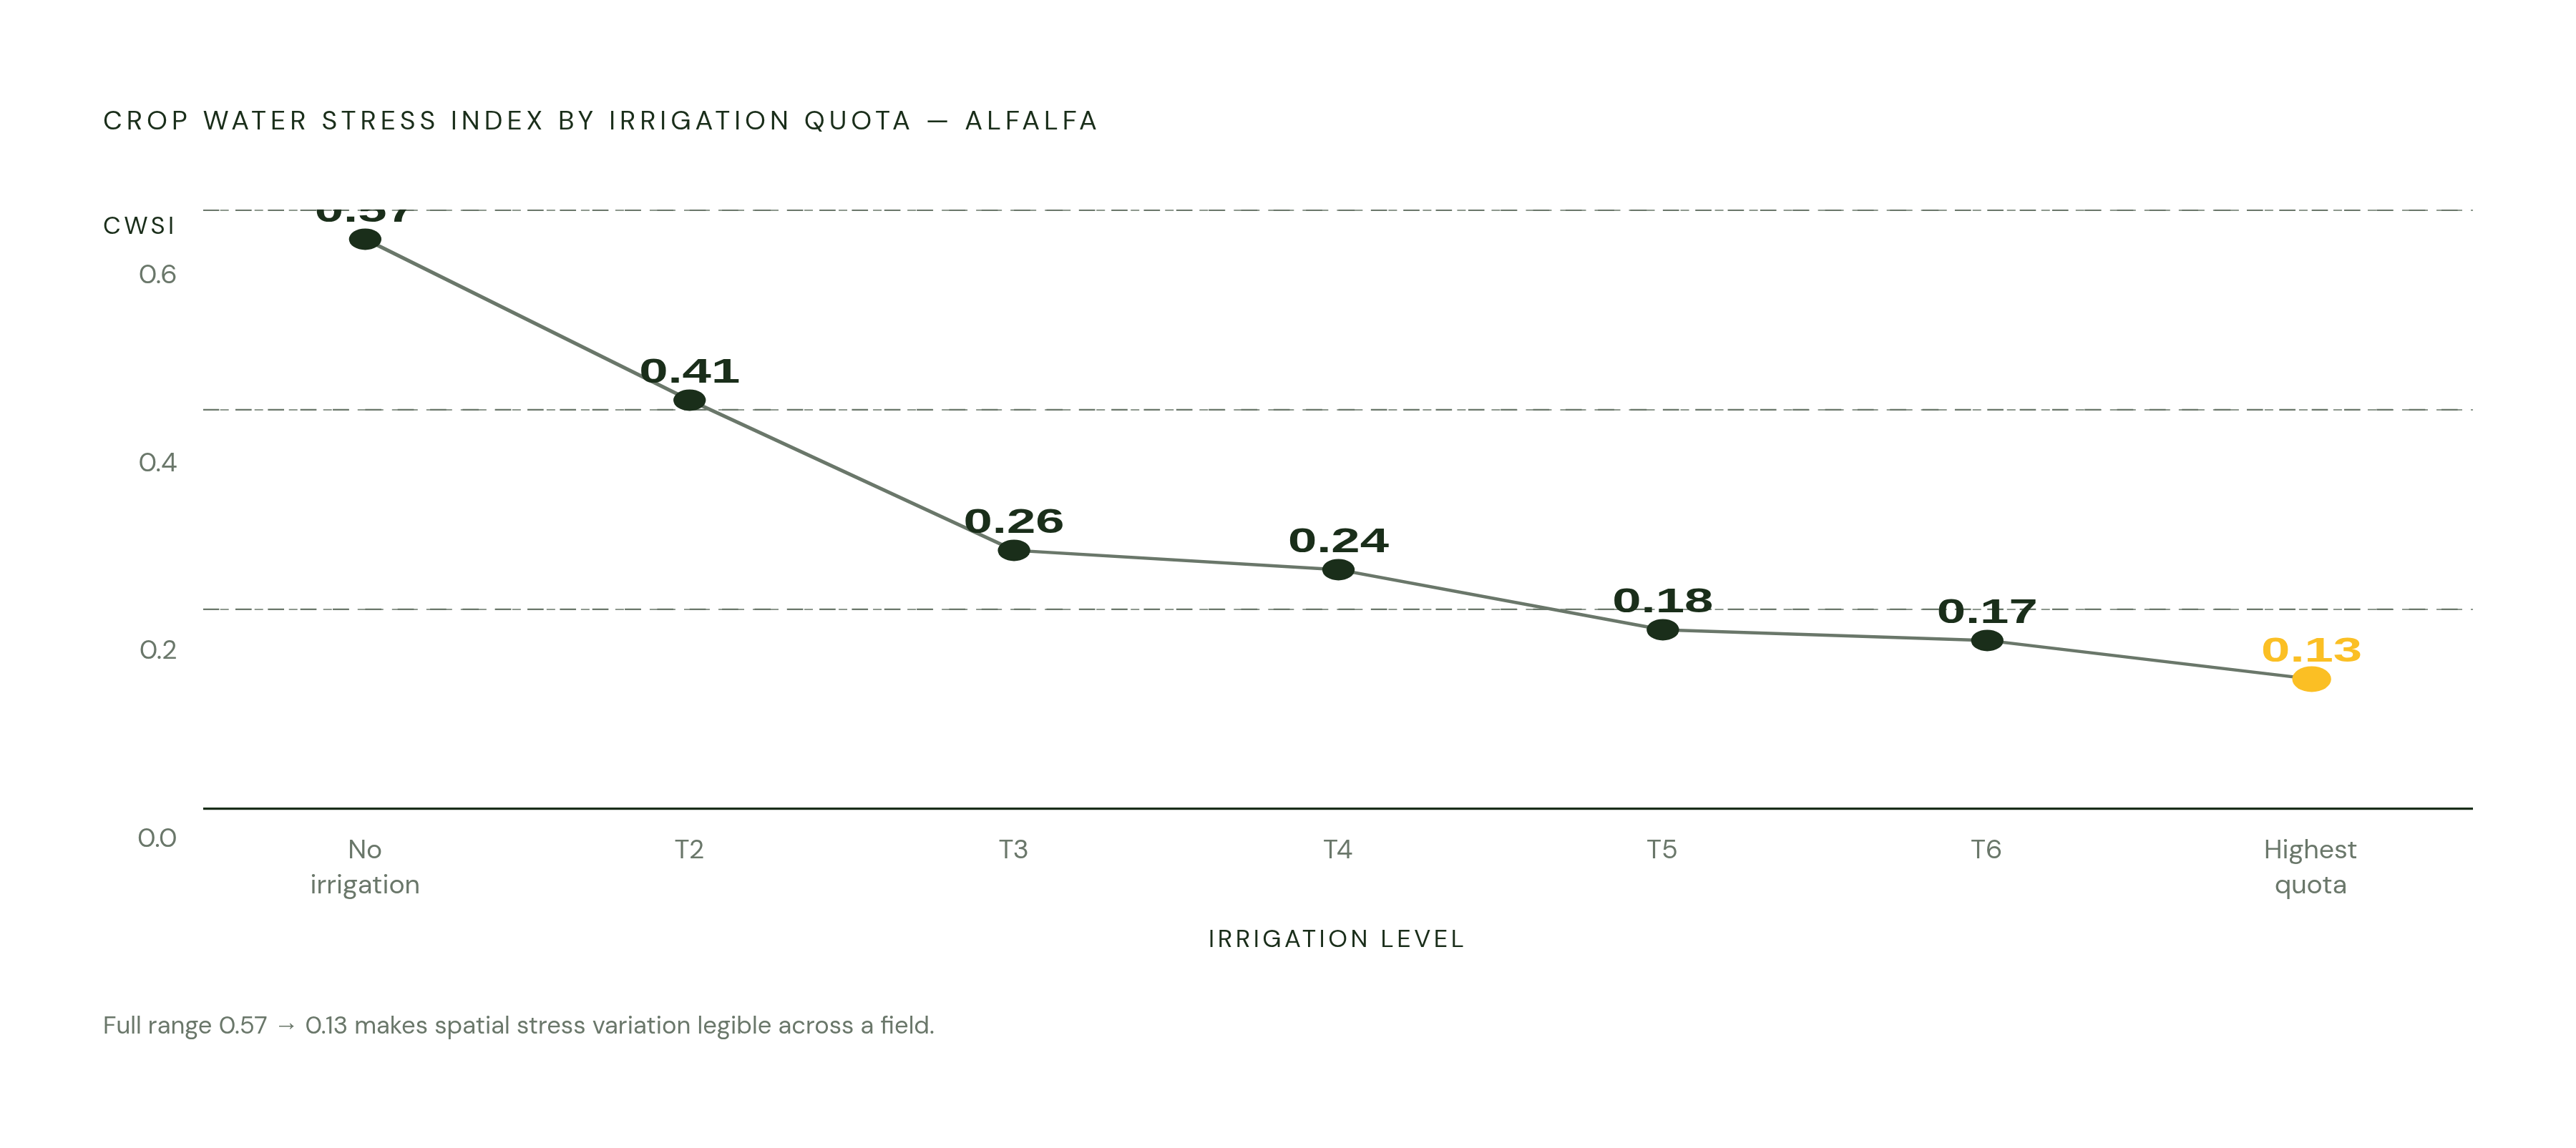
The logic behind CWSI runs backward from what most people would guess: when soil moisture is sufficient, the index moves toward zero, and when the crop is running a water deficit, the index climbs. A study on alfalfa tested that relationship across a range of irrigation quotas and recorded CWSI values of 0.57 for the no-irrigation control, then 0.41, 0.26, 0.24, 0.18, 0.17, and 0.13 as irrigation quota increased. Laid out that way, the progression makes uneven irrigation across a field appear immediately on a map, not buried as one more number on a spreadsheet.
Getting that kind of accuracy depends on getting the underlying temperature retrieval right, and recent work backs it up. A 2026 study in tea plantations validated a UAV-based thermal infrared retrieval method against ground measurements and found a maximum absolute error under 0.3°C, with an R² above 0.999 between measured and predicted canopy temperature. That's about as tight a correlation as remote sensing tends to produce anywhere, and it says the method holds up under scrutiny, not just under ideal conditions in one field on one good day.
Planning and executing a thermal drone survey in the field
Timing decides whether a survey is readable or a wasted battery. Early morning and late afternoon give the widest gap between ambient and surface temperatures, which is when subtle anomalies stand out clearest. Fly at midday instead, and the sun heats the soil evenly enough to wash out the very signatures the survey exists to find. Treating flight time as a scheduling convenience instead of the variable that decides whether the data means anything is the single most common mistake in a first-time survey.
Flight planning otherwise follows standard UAV mapping practice. Automated flight paths with overlapping image coverage stitch into a full-field mosaic, and altitude sets the tradeoff between how much ground a flight covers and how fine the resolution is on any one anomaly.
Sensor choice affects what's even feasible to fly: an uncooled microbolometer sensor picks up thermal emission off vegetation and soil without needing a cooled detector, which keeps the hardware light enough for a standard multi-rotor.
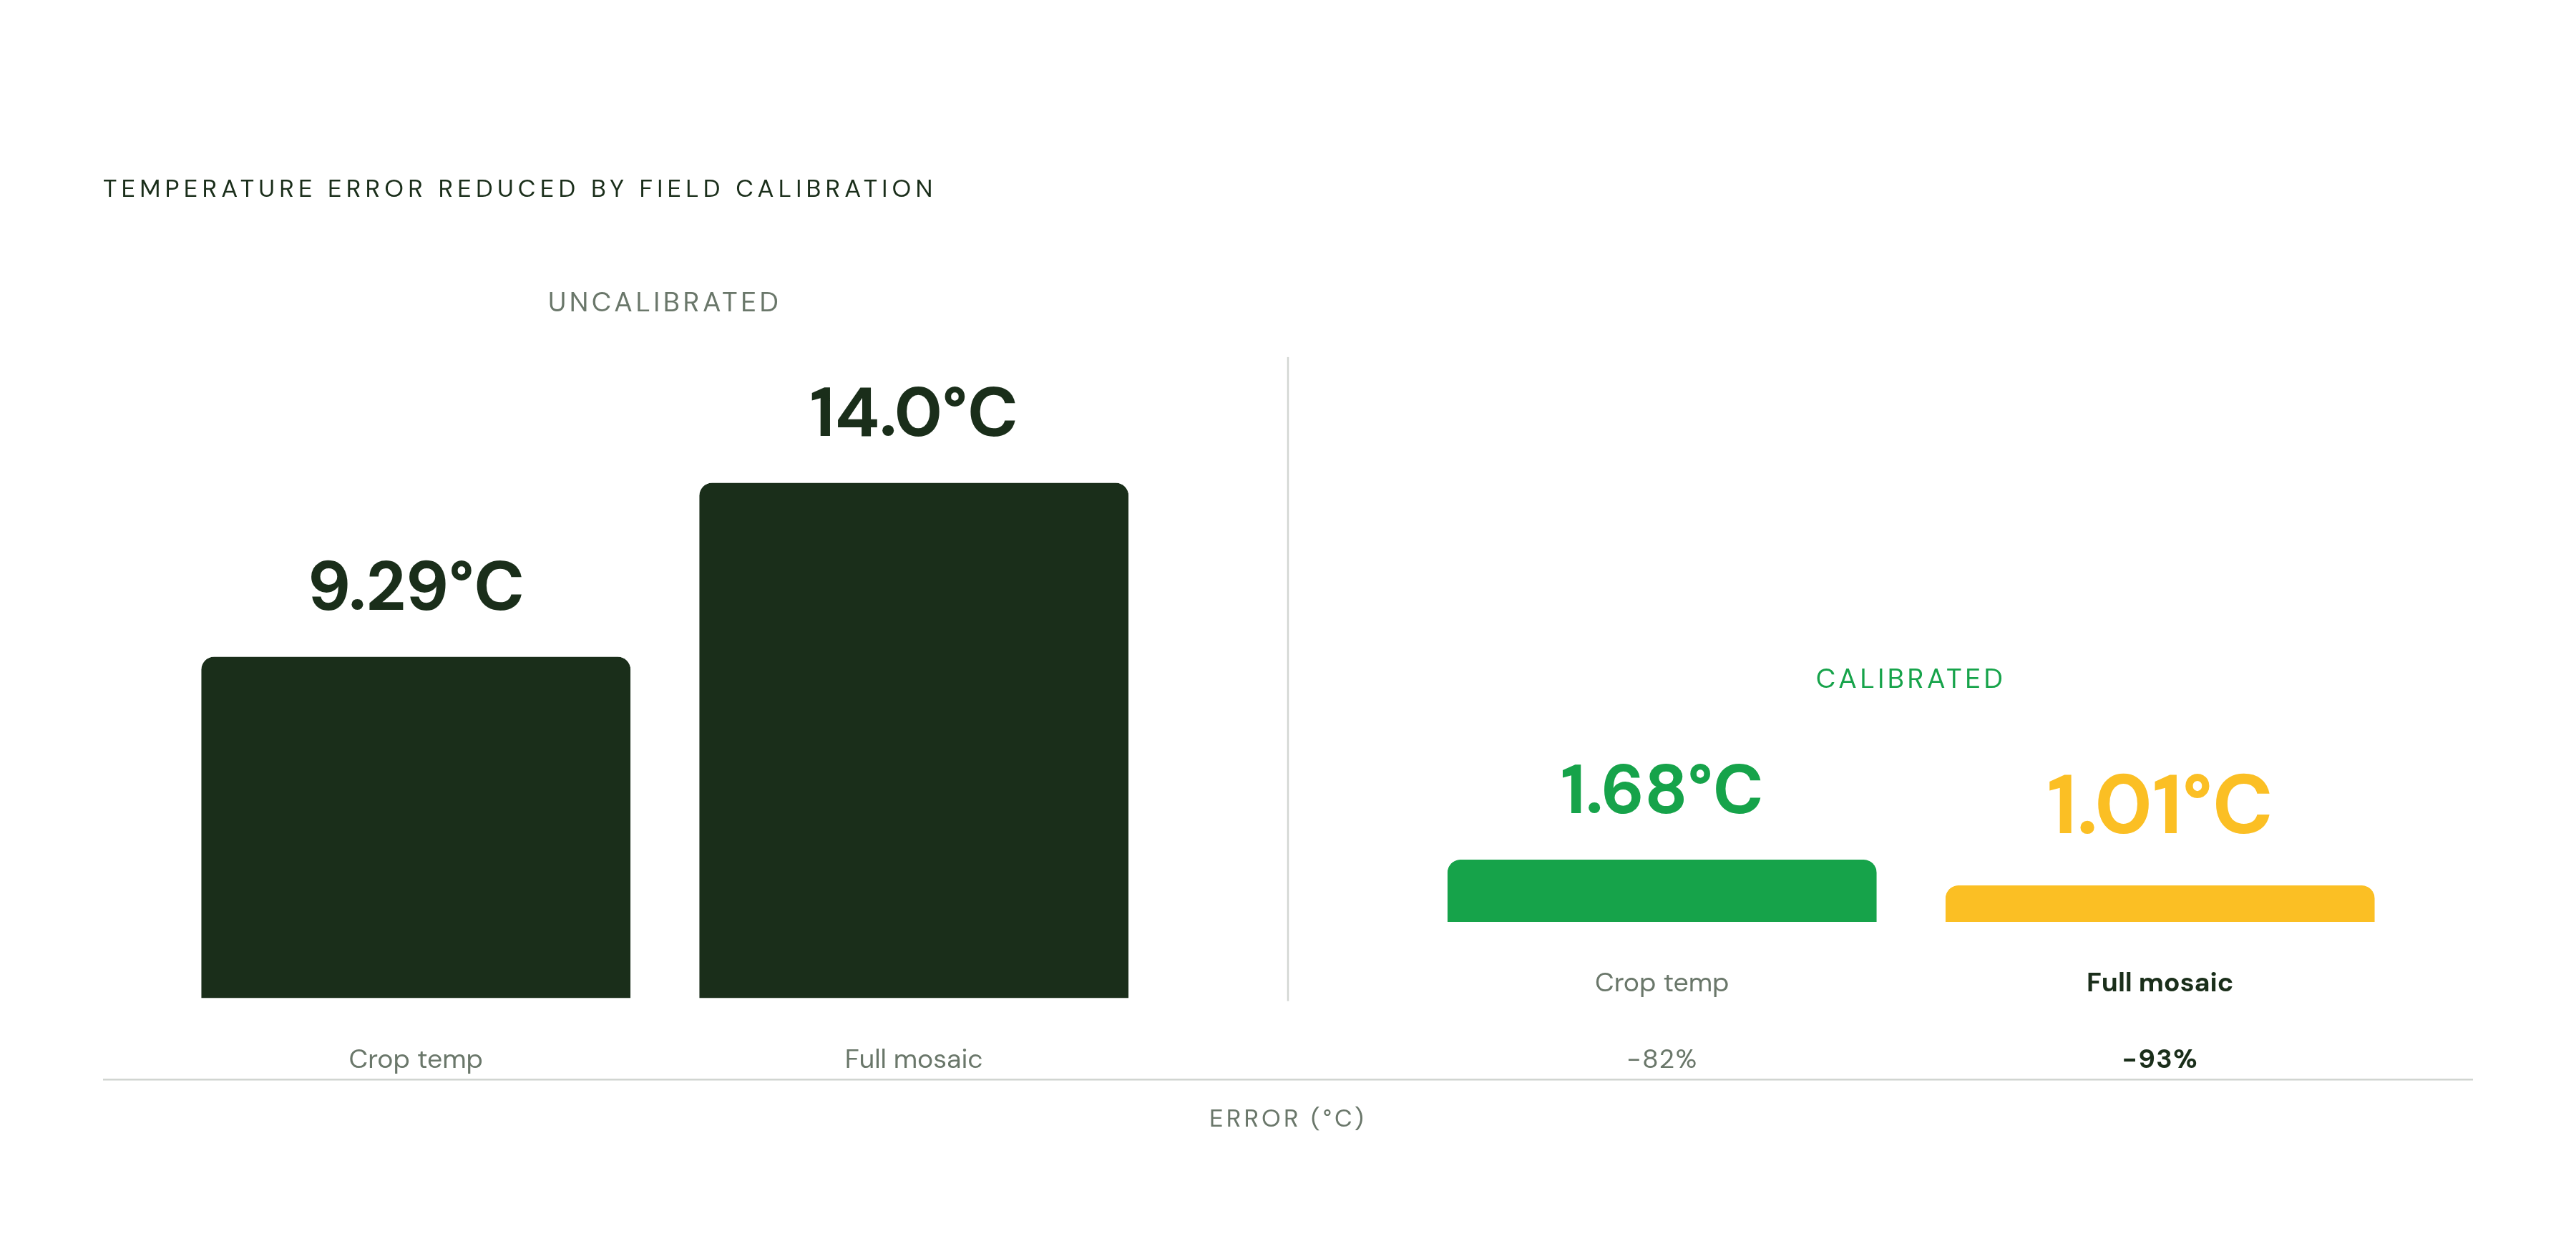
Calibration is the step that separates a usable survey from a nice-looking picture, and skipping it is the most expensive shortcut on the table. Field calibration against temperature-controlled ground reference panels cuts crop temperature error from 9.29°C in raw, uncalibrated imagery down to 1.68°C. Full mosaics tell a similar story: errors as large as 14.0°C in uncalibrated imagery drop to about 1.01°C once calibration gets applied. Raw thermal data straight off the sensor is not accurate enough to base an irrigation decision on, and treating it as if it were is how a survey ends up worse than useless.
Hardware options for thermal irrigation surveys
A handful of platforms cover most of the field right now, and the right pick depends on the job, not on brand loyalty.
The DJI Mavic 3T sits in the middle: a multi-rotor with an integrated dual RGB/TIR camera, used in a 2024 MDPI vineyard study that captured TIR imagery at ±2°C accuracy, alongside a wide RGB camera and a secondary 12-megapixel telephoto lens. It's the platform behind that vineyard irrigation leak detection study published the same year.
DJI's Matrice 4TD steps up to autonomous operation, built for irrigation surveys that run around the clock through the Dock 3 docking system, which lets a large operation get on-demand aerial coverage without a pilot standing by for every flight. That's the platform worth reaching for once flight frequency, not image quality, becomes the bottleneck. The Autel EVO Lite 640T Enterprise takes the opposite approach: compact, lightweight, and built for rapid deployment and thermal scanning. The FLIR Boson 640 shows up as the thermal imager inside a published UAV system built specifically for CWSI calculation and water stress mapping, and it's a sensor rather than a platform, a component that ends up bolted into a custom rig instead of bought off a shelf.
For most operations weighing these options, the Mavic 3T is the sensible starting point and the Matrice 4TD is the wrong first purchase: docked autonomy only pays off once flight frequency is already a bottleneck, and buying into it before then just parks capital on a hangar shelf.
Crops and irrigation types with the most to gain
Vineyards lead this field by a wide margin, and the case for starting there instead of anywhere else isn't close. A review covering 104 scholarly articles published between 2012 and 2024 confirmed vineyards as the most-studied crop for precision irrigation work, and the 2024 MDPI Drones paper specifically demonstrated leak and damage detection in vineyard drip irrigation systems by combining RGB and thermal imagery. Drip systems fit this kind of survey especially well, since a failed emitter produces a small, sharply bounded thermal anomaly that's easy to isolate against uniform rows.
Tea plantations represent newer ground. The August 2026 Sensors study built and validated a UAV-based thermal infrared framework for tea canopy temperature retrieval, aimed specifically at irrigation decision support, and its results suggest the method carries well beyond the one crop it was built on first.
Cotton has its own body of evidence behind it. A study on cotton used UAV thermal infrared imagery to evaluate water stress across different irrigation treatments, and found CWSI held up as a useful stress indicator even in humid southeastern U.S. conditions, where ambient humidity tends to complicate thermal readings.
Sweet orange orchards round out the picture. A paper in Irrigation Science paired thermal and multispectral cameras on UAV missions to monitor water stress in citrus trees, calculating stress indices from the resulting ortho-images.
Row crops on flood or furrow irrigation are at the other end of this list, and the evidence base for them is thin next to what exists for vineyards, tea, and citrus. That gap isn't an accident: drip systems throw off small, sharp, isolatable anomalies, while a furrow-flooded field produces a messier thermal picture that's harder to pin to a single failed component.
The cost of a thermal survey
There are two ways to get thermal data on a field: buy the hardware, or pay for the flight as a service. Service pricing skips the upfront capital entirely, which matters most for an operation still testing whether the method earns its keep.
Buying only makes sense at scale, and most operations overestimate how fast they'll get there. An operation flying large acreage repeatedly amortizes hardware cost fast, and autonomous docking platforms like the Matrice 4TD paired with Dock 3 let that repeat flying happen without a per-flight service bill stacking up over a season. A smaller operation flying once or twice a year should just pay for the flight: buying a sensor for two flights a year is money left on the table, no matter how good the hardware looks on a spec sheet. A large operation running weekly or monthly surveys across thousands of acres faces a different equation entirely, one where the hardware pays for itself against the service fees it replaces within a season or two.
The decision comes down to acreage, flight frequency, and whether anyone on staff can fly the mission and process the data, or whether that work is better left to a provider who already owns the calibration workflow and the platform.